Reading the Main Clerk.io Dashboard and Tracked Orders
Reading the Dashboard
Customer Spend
The total number of orders and average extra order value used to make the “Extra Revenue” calculation are filtered to the time frame selected (the default time frame is last 30 days).
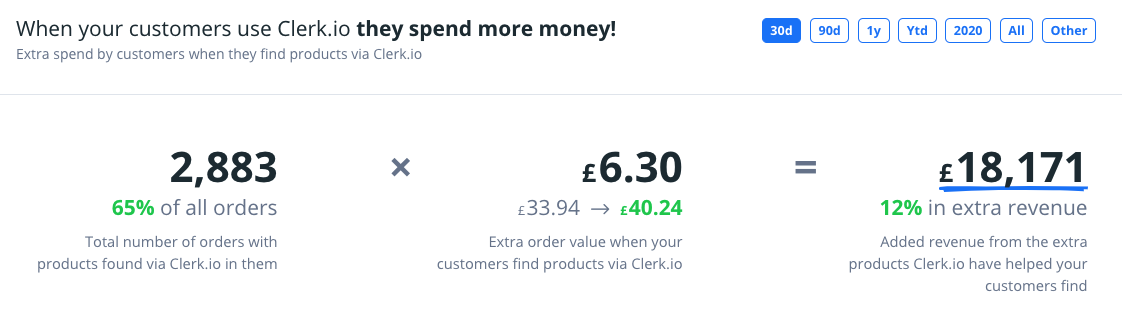
Extra Revenue is calculated by:
(# of orders that include products found via Clerk.io) * (Average extra order value generated when products are found via Clerk.io) = Extra Revenue
Revenue (broken down by Clerk.io Product and non-Clerk.io revenue)
The Revenue chart shows the ratio of revenue generated from different sources, breaking down revenue coming from Clerk.io Recommendations (shown in green), Clerk.io Search ( yellow), Clerk.io Email ( red), and Organic / non-Clerk.io revenue ( light blue).
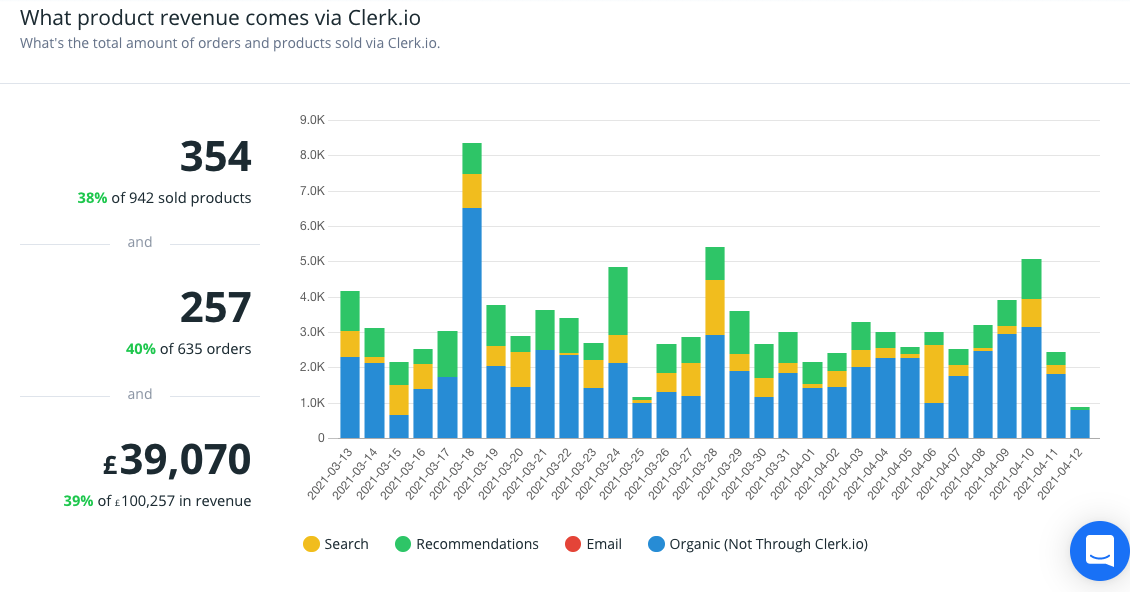
To the left of the chart, you’ll find:
The total number of products purchased through any of the Clerk.io Products (Search, Recommendations, Email) enabled in your webshop
Total number of orders including at least one product found through Clerk.io, and
Total revenue generated through products found via Clerk.io.
Green percentages represent the proportion of sold products, orders, and revenue that were generated through Clerk.io. All of these sections are filtered by the time frame selected at the top of the Dashboard page ( default time frame is last 30 days).
Average Order Value (broken down by Clerk.io Product)
The line chart breaks down the average order value when an order includes products found using Clerk.io’s Search ( yellow), Email ( red), or Recommendations ( green), as well as the overall average order value ( dashed blue line) and non-Clerk.io average order value ( grey line).
On the left, you’re provided the average increase in order value when customers find and purchase products via Clerk.io Search, Email, and/or Recommendations vs. the store average order value.
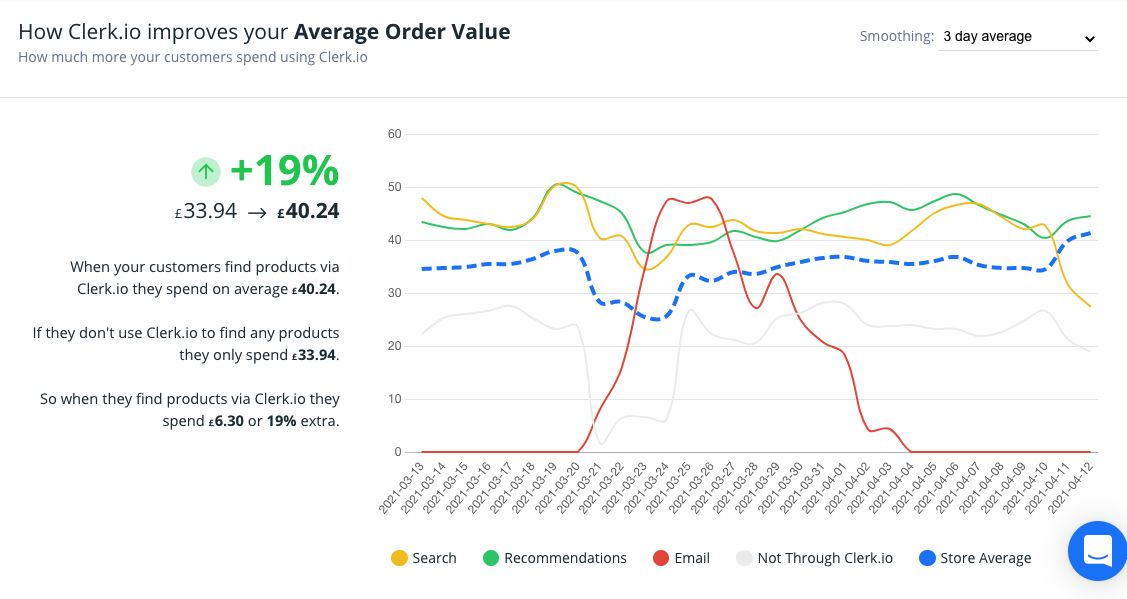
In this example, the average order value is 19% higher when customers find and buy products via Clerk.io vs. average order value when all products in an order are found without Clerk.io.
Basket Size Improvements (broken down by Clerk.io Product)
The Basket Size chart is read just like Average Order Value, but Basket Size measures the average number of items purchased that were found via Clerk.io.
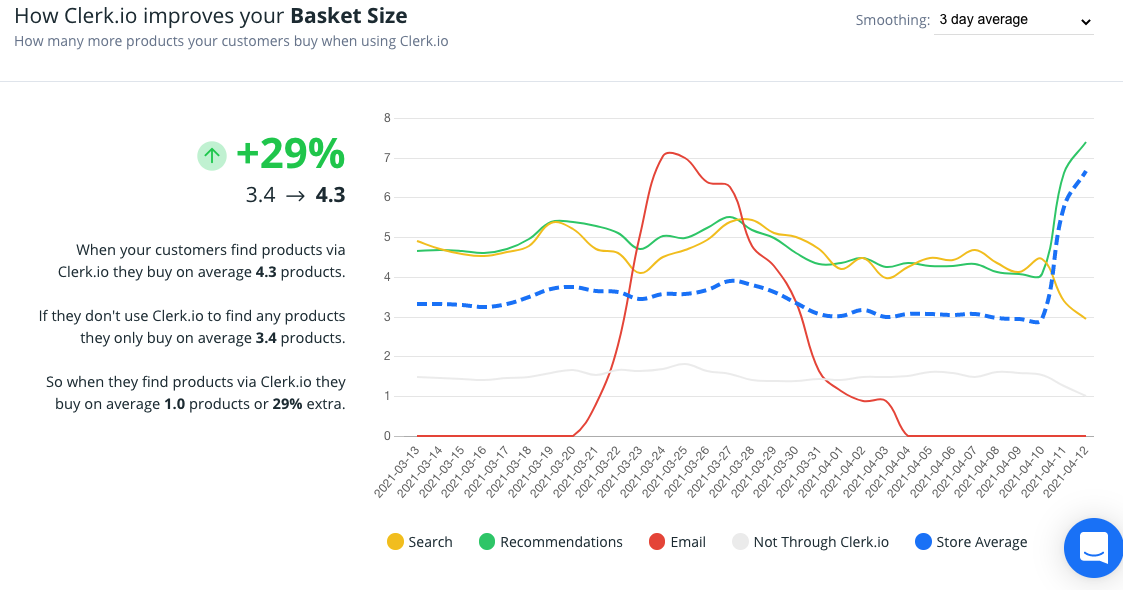
In this example, the average basket is 29% larger when Clerk.io is used to find products in the order vs. when their order does not include products found via Clerk.io
The green percentage to the left of the line chart indicates the average increase of an order’s basket size when products in the order are found via Clerk.io vs. overall average basket size.
This is calculated as:
(Average Basket Size with products found via Clerk.io - Overall Average Basket Size) / (Overall Average Basket Size)
Conversion Rate Improvements (broken down by Clerk.io Product)
The Conversion Rate chart is also broken down like Average Order Value and Basket Size, but Conversion Rate measures the percentage of Clerk.io Search/Recommendation/Email click-throughs that result in purchases vs. the store’s total product click-throughs that result in purchases.
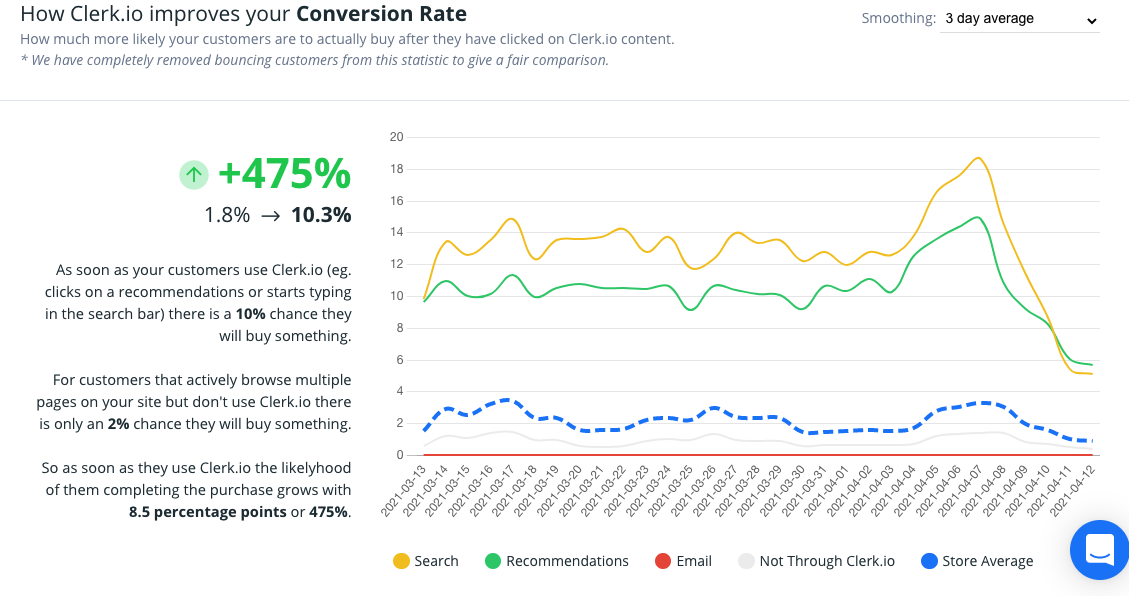
On the left side of the Conversion Rate section, the clerk Conversion Likelihood ( green percentage) is calculated as:
( Clerk.io Purchase Likelihood - Store Average Purchase Likelihood) / (Store Average Purchase Likelihood)
Performance Benchmark for each Clerk.io Product
The Performance Benchmark shows how well your active Clerk.io products (Email, Search, and Recommendations) perform on your store compared to other stores using those same Clerk.io products. The further to the right an Email, Search, or Recommendations marker is, the better that Clerk product is performing on your store vs. other Clerk-enabled stores.
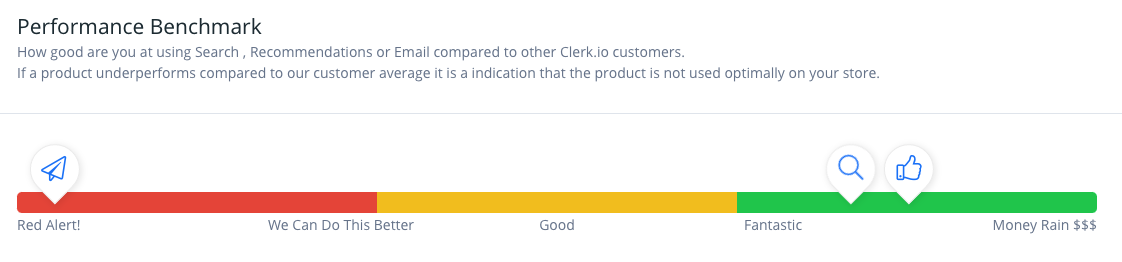
In this example, Search and Recommendations are performing well, but Email is underperforming compared to other stores. Underperforming Clerk products means your usage of the product needs to be modified to increase conversion.
Reading Tracked Orders
In Tracked Orders, you’re provided the Order ID, time the order was placed, number of items in the basket, total order value, and value added to the order via products found through Clerk.io.
“ Impact from Clerk.io” is a blue bar visualising the percentage of the order that was found via. Clerk.io vs. non-Clerk.io sources.
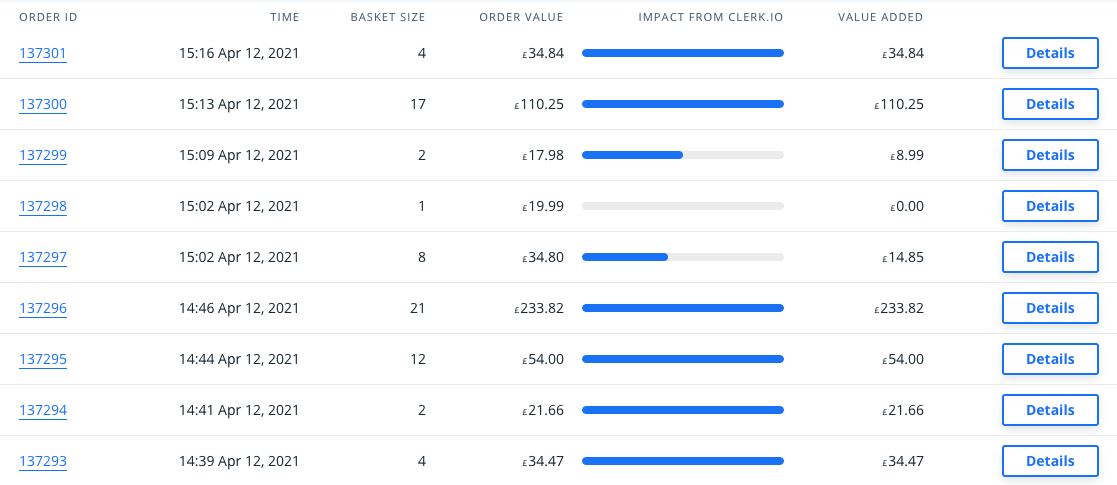
Just like the main Dashboard, you can filter these orders by the desired time frame, with the default set to the past 30 days.
Order Details
Order Details provide more insight into the specifics of an order, including a list of the Products purchased, how many of each Product were purchased, and the value by Product.
When the product is found and added to an order using a “Clerk.io Source”, this is included in Details.
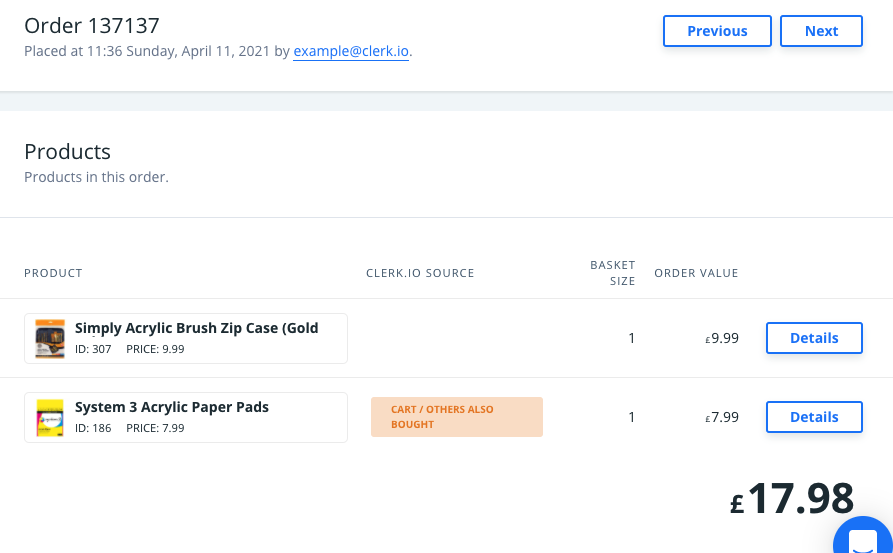
In the above example, “Simply Acrylic Brush Zip Case” was found/added through a non-Clerk.io source, while “System 3 Acrylic Paper Pads” were found and added through Cart Recommendations.