Using your Company Overview dashboard
You may have multiple stores or companies that you use with Clerk.io. Having access to an overview of all your stores/companies and the most important data that you need, will save you time by quickly highlighting where you need to focus your attention when making critical business decisions.
The Company Overview dashboard gives you complete insight to every store in one place. Whether you want to check your total revenue or just want to see if your all your stores have synced successfully, you can see all this easy to read information in the Company Overview dashboard and make changes based on your business goals.
The Company Overview can be found in the same place that you find your list of stores. Simply click the drop down in the top left of your Clerk.io backend and select the top option called Company Overview.
Once selected, you will be presented instantly with an overview of all your stores.
The Company Overview is broken down into combined company data such as total revenue, average conversion rate increase, average basket size increase, average order value increase and key individual store data like store name, sync status, revenue through Clerk.io, conversion rate, basket size and average order value.
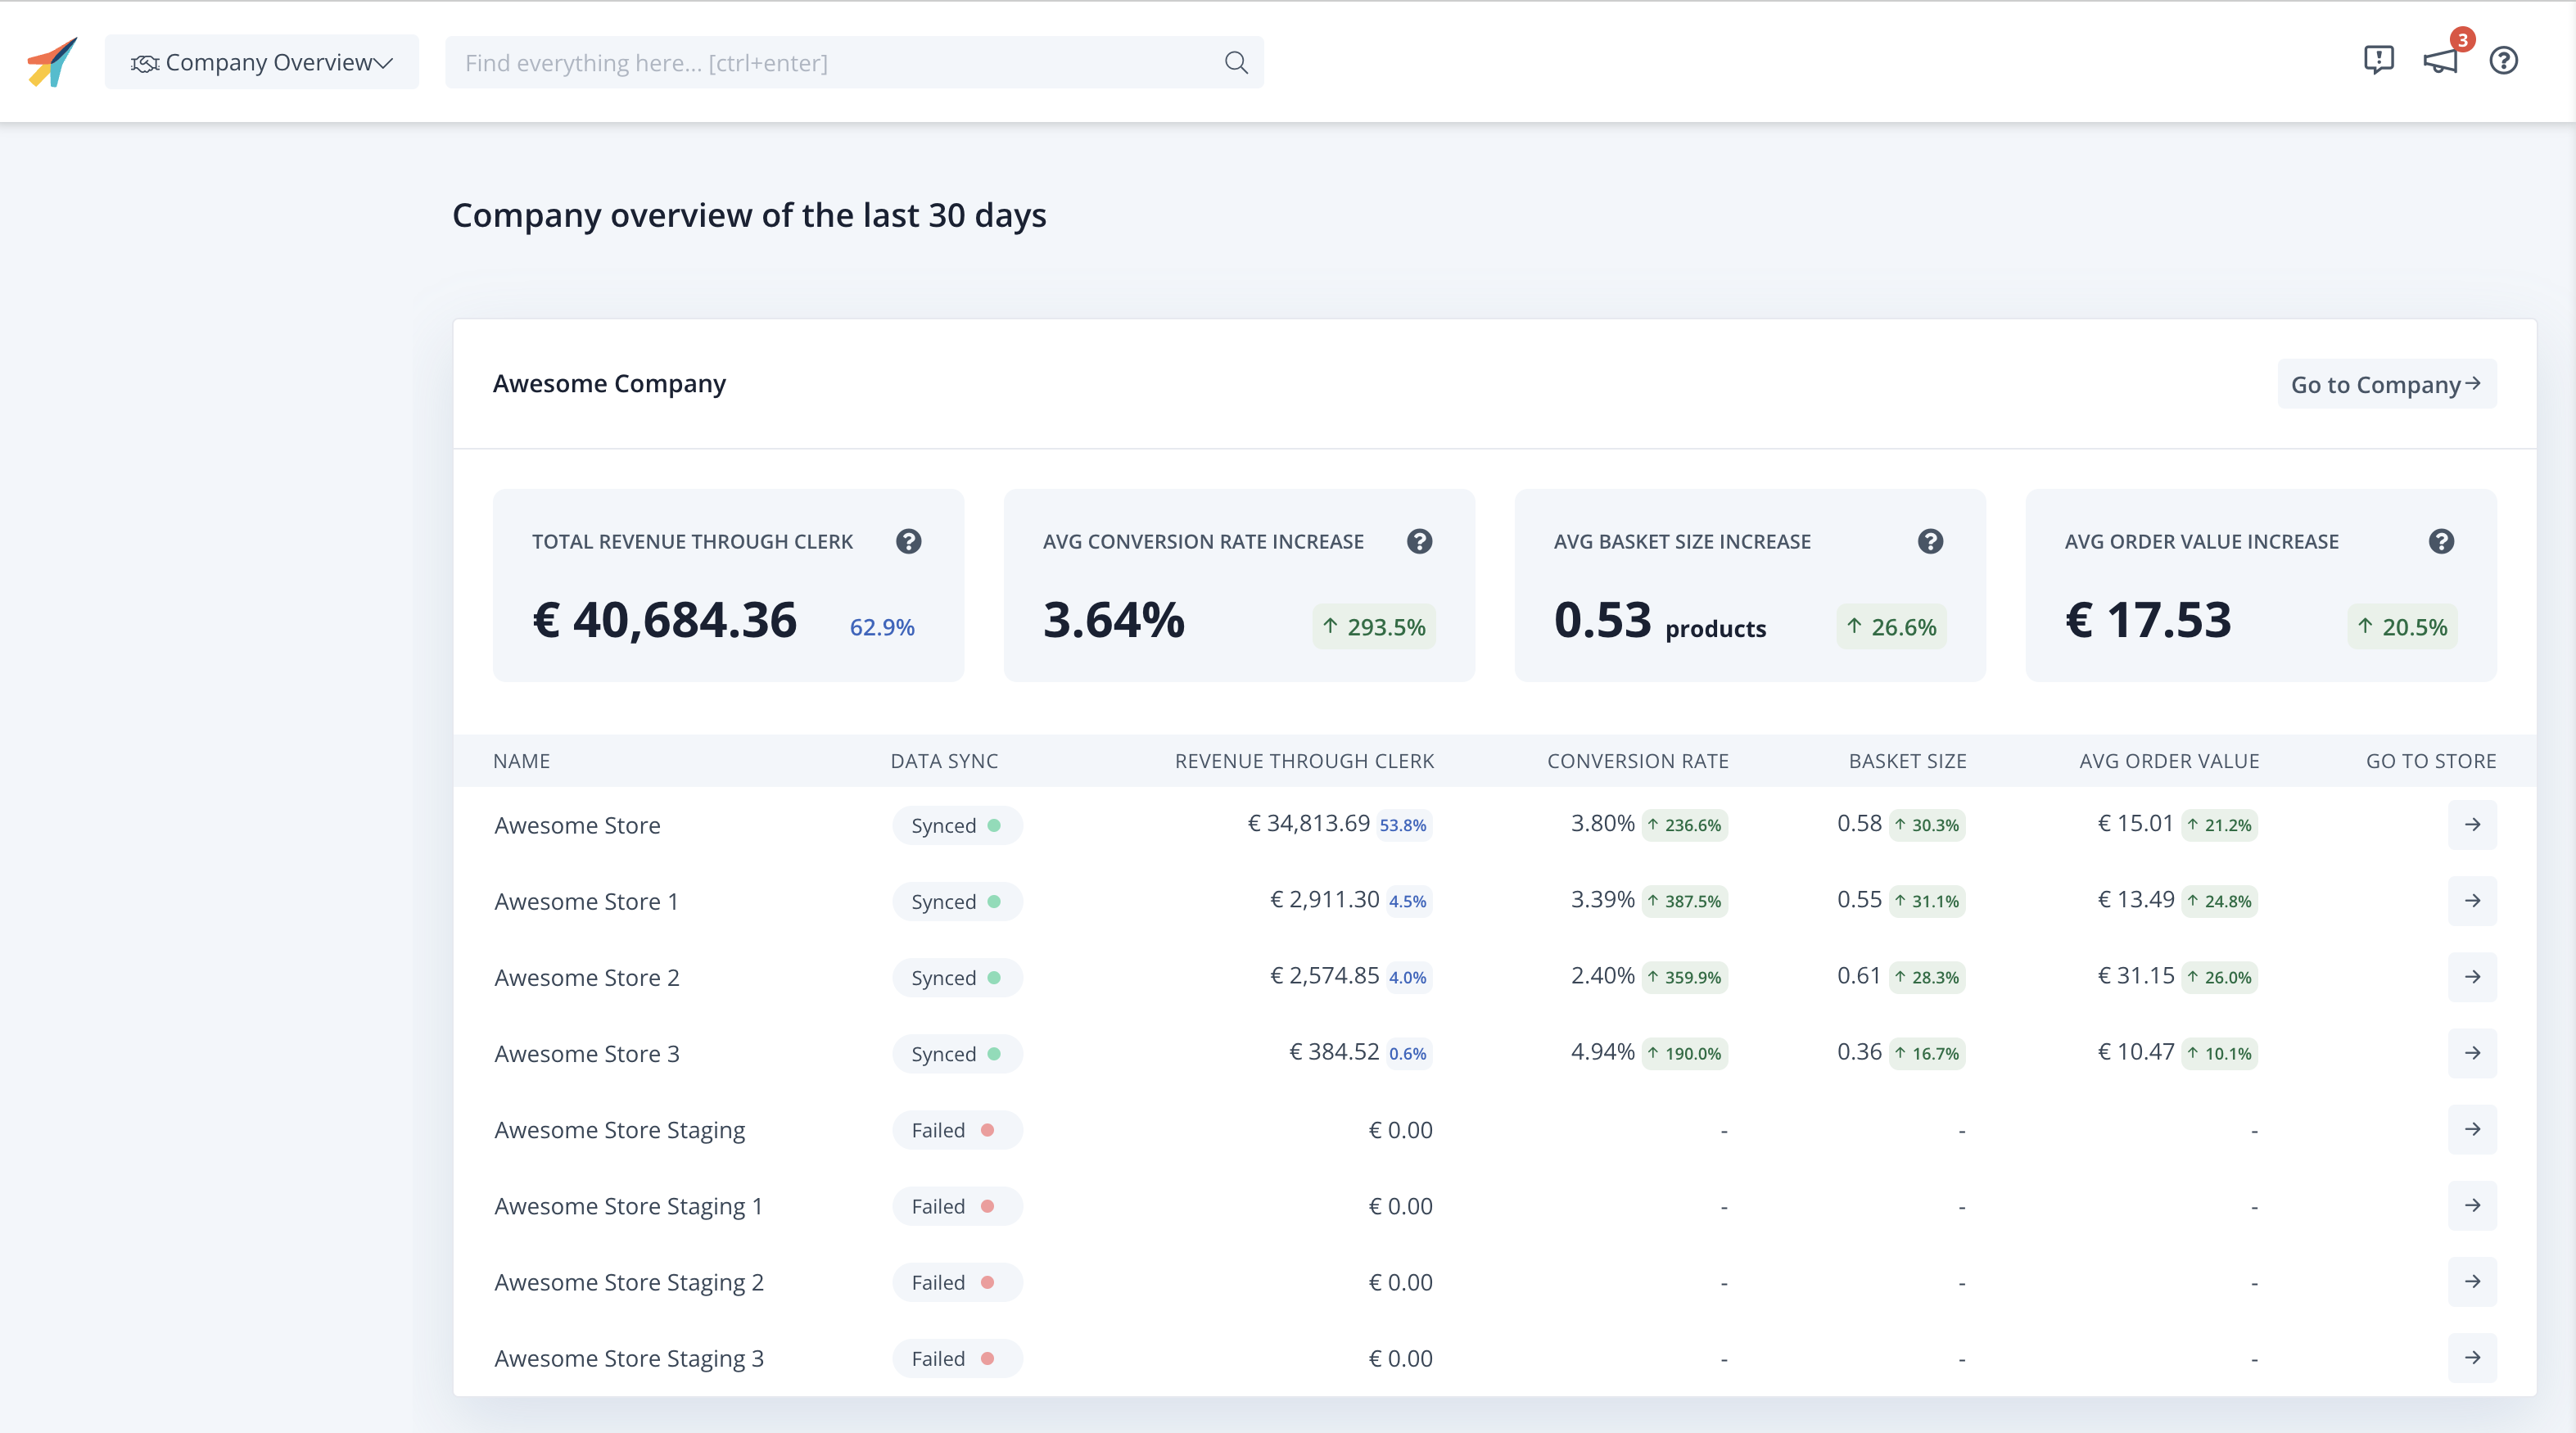
Company Data
The company data is divided into 4 key sections to make it easier to get an idea of how your company is doing.
Total revenue through Clerk.io: This is the total revenue added by Clerk, and how big a part of your total revenue is from this company.
Average conversion rate increase: The total difference measured in percentage points, and the relative increase compared to organic orders.
Average basket size increase: The total difference measured in amount of products , and the relative increase compared to organic orders.
Average order value increase: The total difference measured in revenue, and the relative increase compared to organic orders.
Store Data
The store data is divided into 6 key sections, breaking down the performance, allowing you to make the best decision on where to focus your time and energy.
Name: The name of the store.
Data sync: The status of your stores data sync (Synced/Failed).
Revenue through Clerk: The stores total revenue increase added by Clerk.io.
Conversion rate: The stores total conversion rate increase added by Clerk.io.
Basket size: The stores total basket size increase added by Clerk.io.
Average order value: The stores total average order value increase added by Clerk.io.
Go to store: Visit the store backend.
Notice:
- If you are a partner that handles multiple Clerk.io companies, you will be able to view them all and their stores in this dashboard.