Analytics
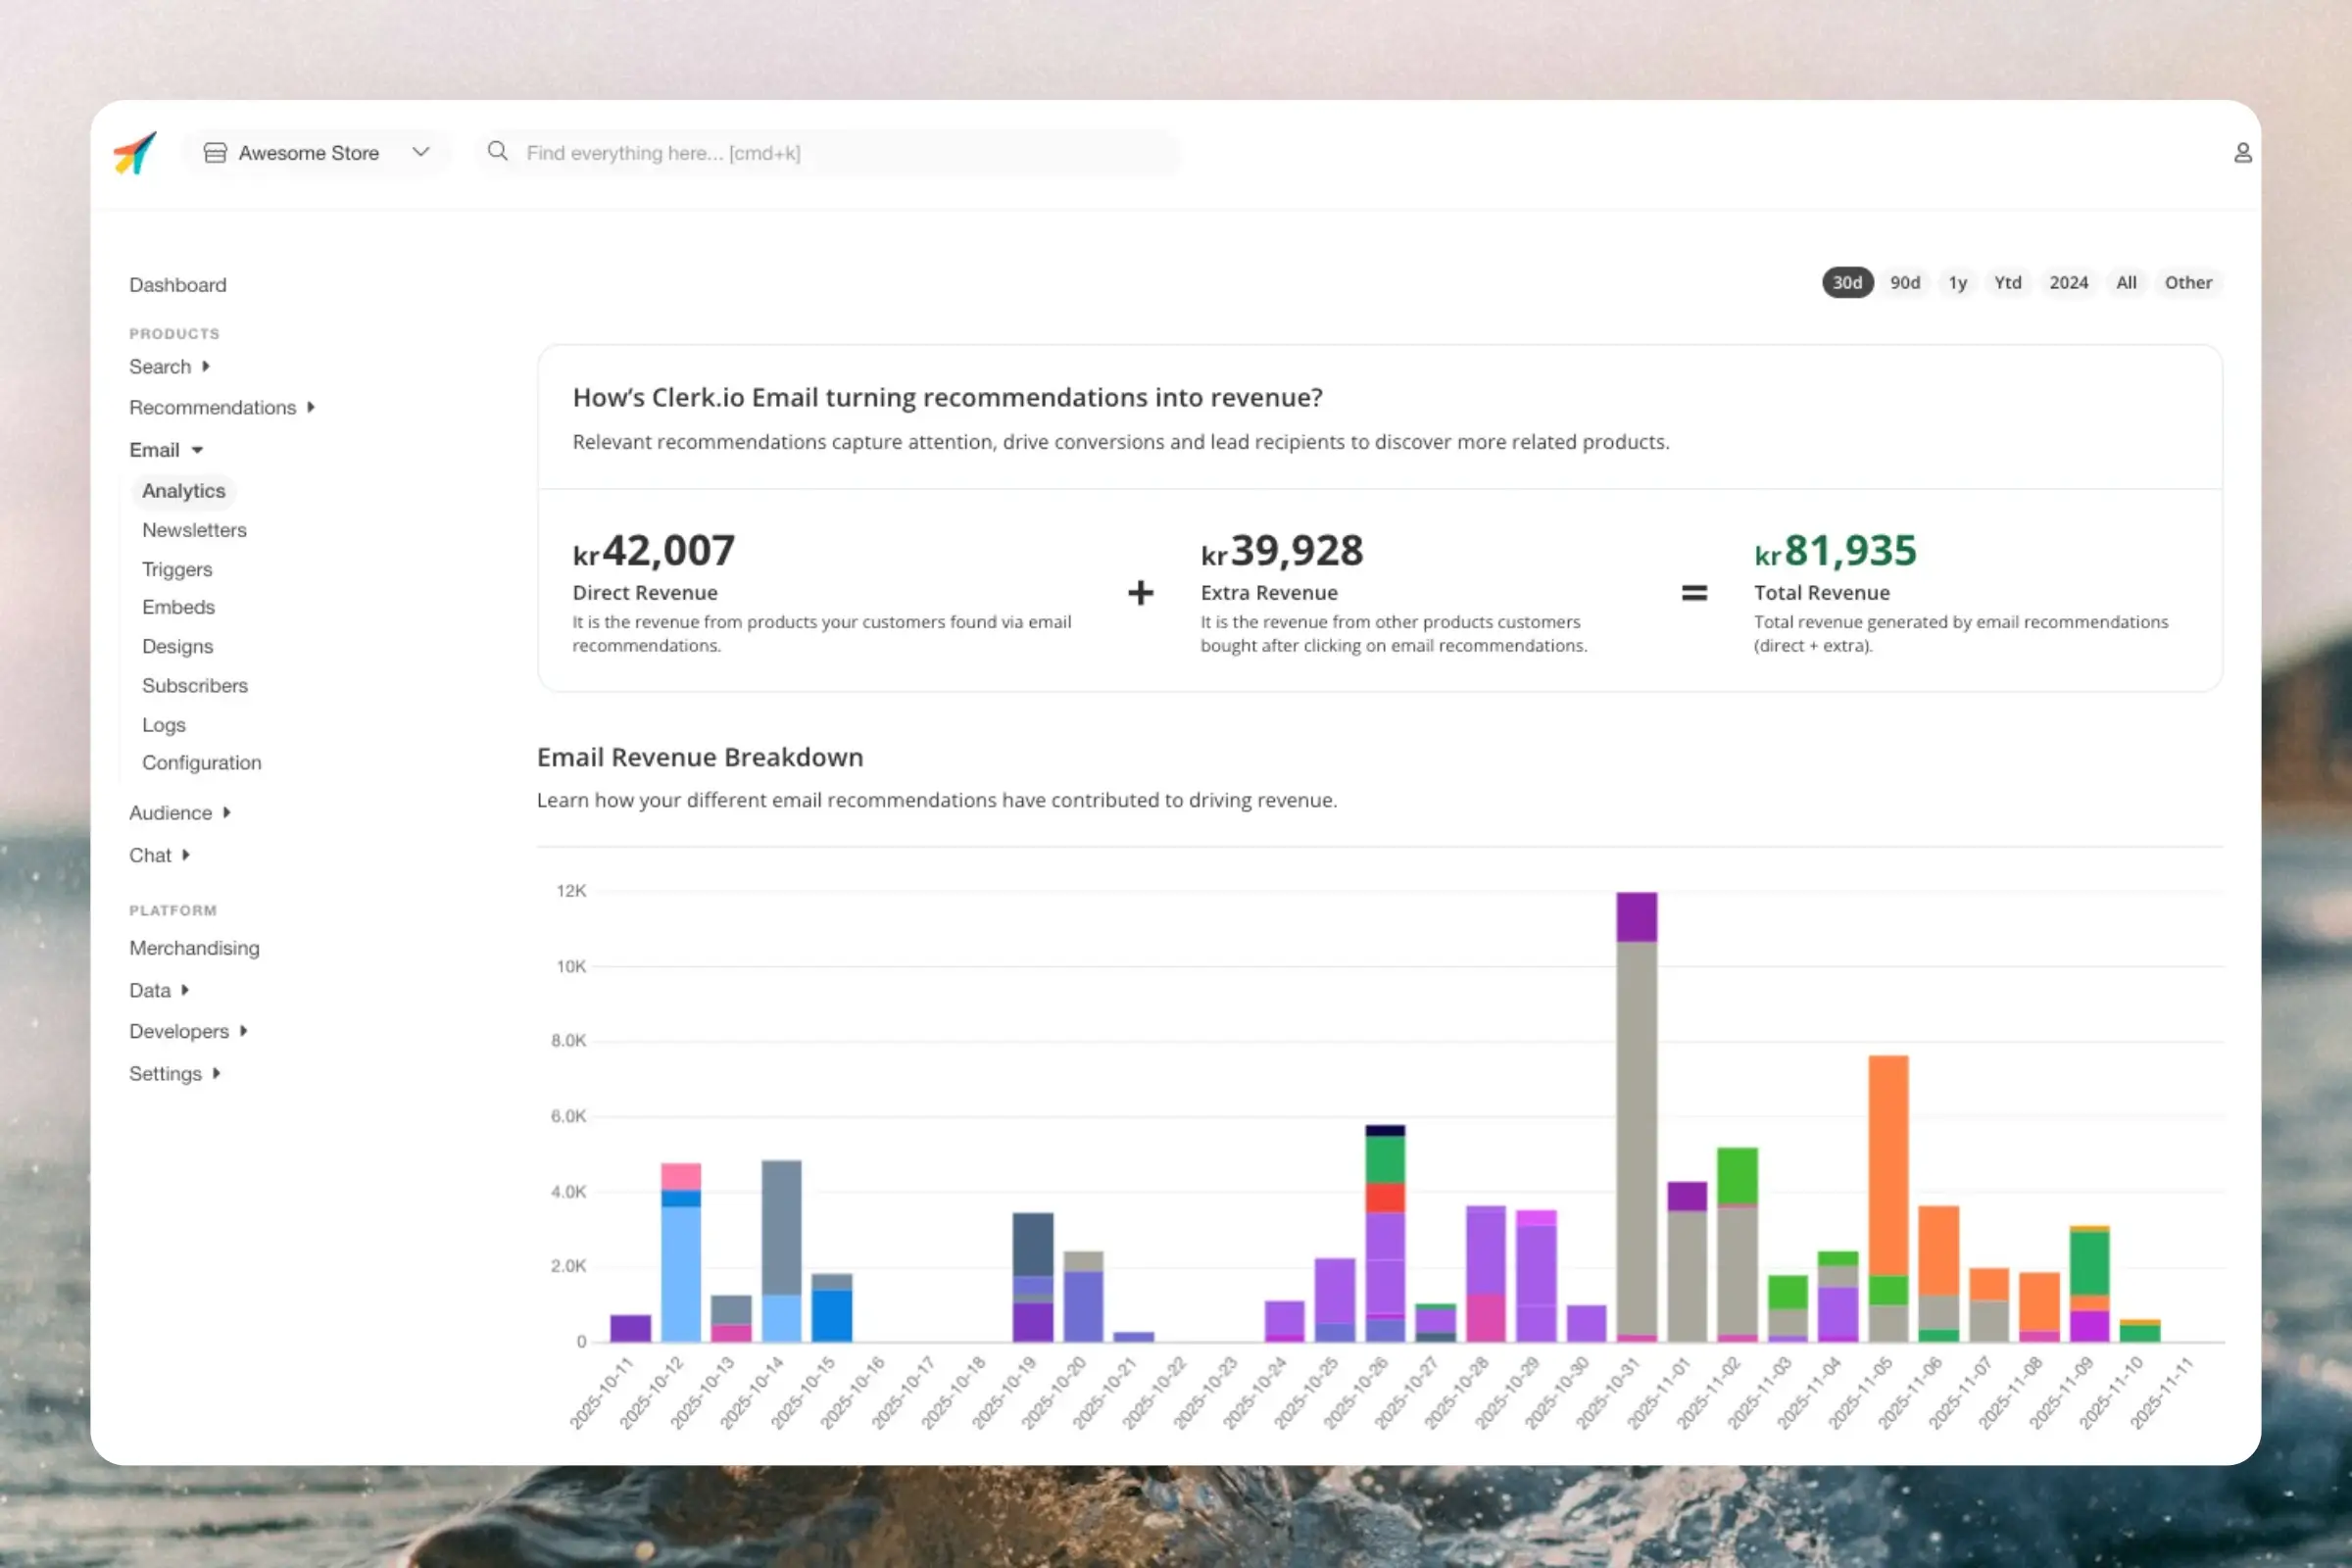
Timeframe #
Use the date-range selector to review 30 days, 90 days, one year, year to date, all data, or a custom period.
Revenue overview #
The overview cards show three parts of email revenue for the selected period:
- Revenue through Email: The full order value after someone clicked in an email.
- Revenue from clicked products: Revenue from products the recipient clicked in the email. This is the same Email number as on Home.
- Revenue from other products in those orders: Other products bought in the same orders, but not clicked in the email.
Revenue from clicked products plus revenue from other products in those orders makes up Revenue through Email. Revenue from clicked products is the same Email number as on Home. Do not add these figures.
Store comparison #
Email Analytics compares conversion rate, average order value, and average basket size for visitors who used Email with your store average. This is a comparison, not a controlled A/B test.
Email revenue #
The Where Email revenue came from (NOK) chart shows revenue by product label over the selected period.
Email embeds #
This table covers Clerk.io product blocks in emails that your store sends itself. Compare each label using revenue, products, orders, average basket size, and average order value.
Engagement #
This section shows how recipients open, click, and buy when emails are sent through Clerk.io. If you send emails through your own email service, use the embed figures to understand the revenue connected to those emails.
AI Campaigns #
AI Campaigns shows performance for newsletters and flows sent through Clerk. If there is no campaign data, the page links to the actions for creating a newsletter or setting up a flow.