Analytics
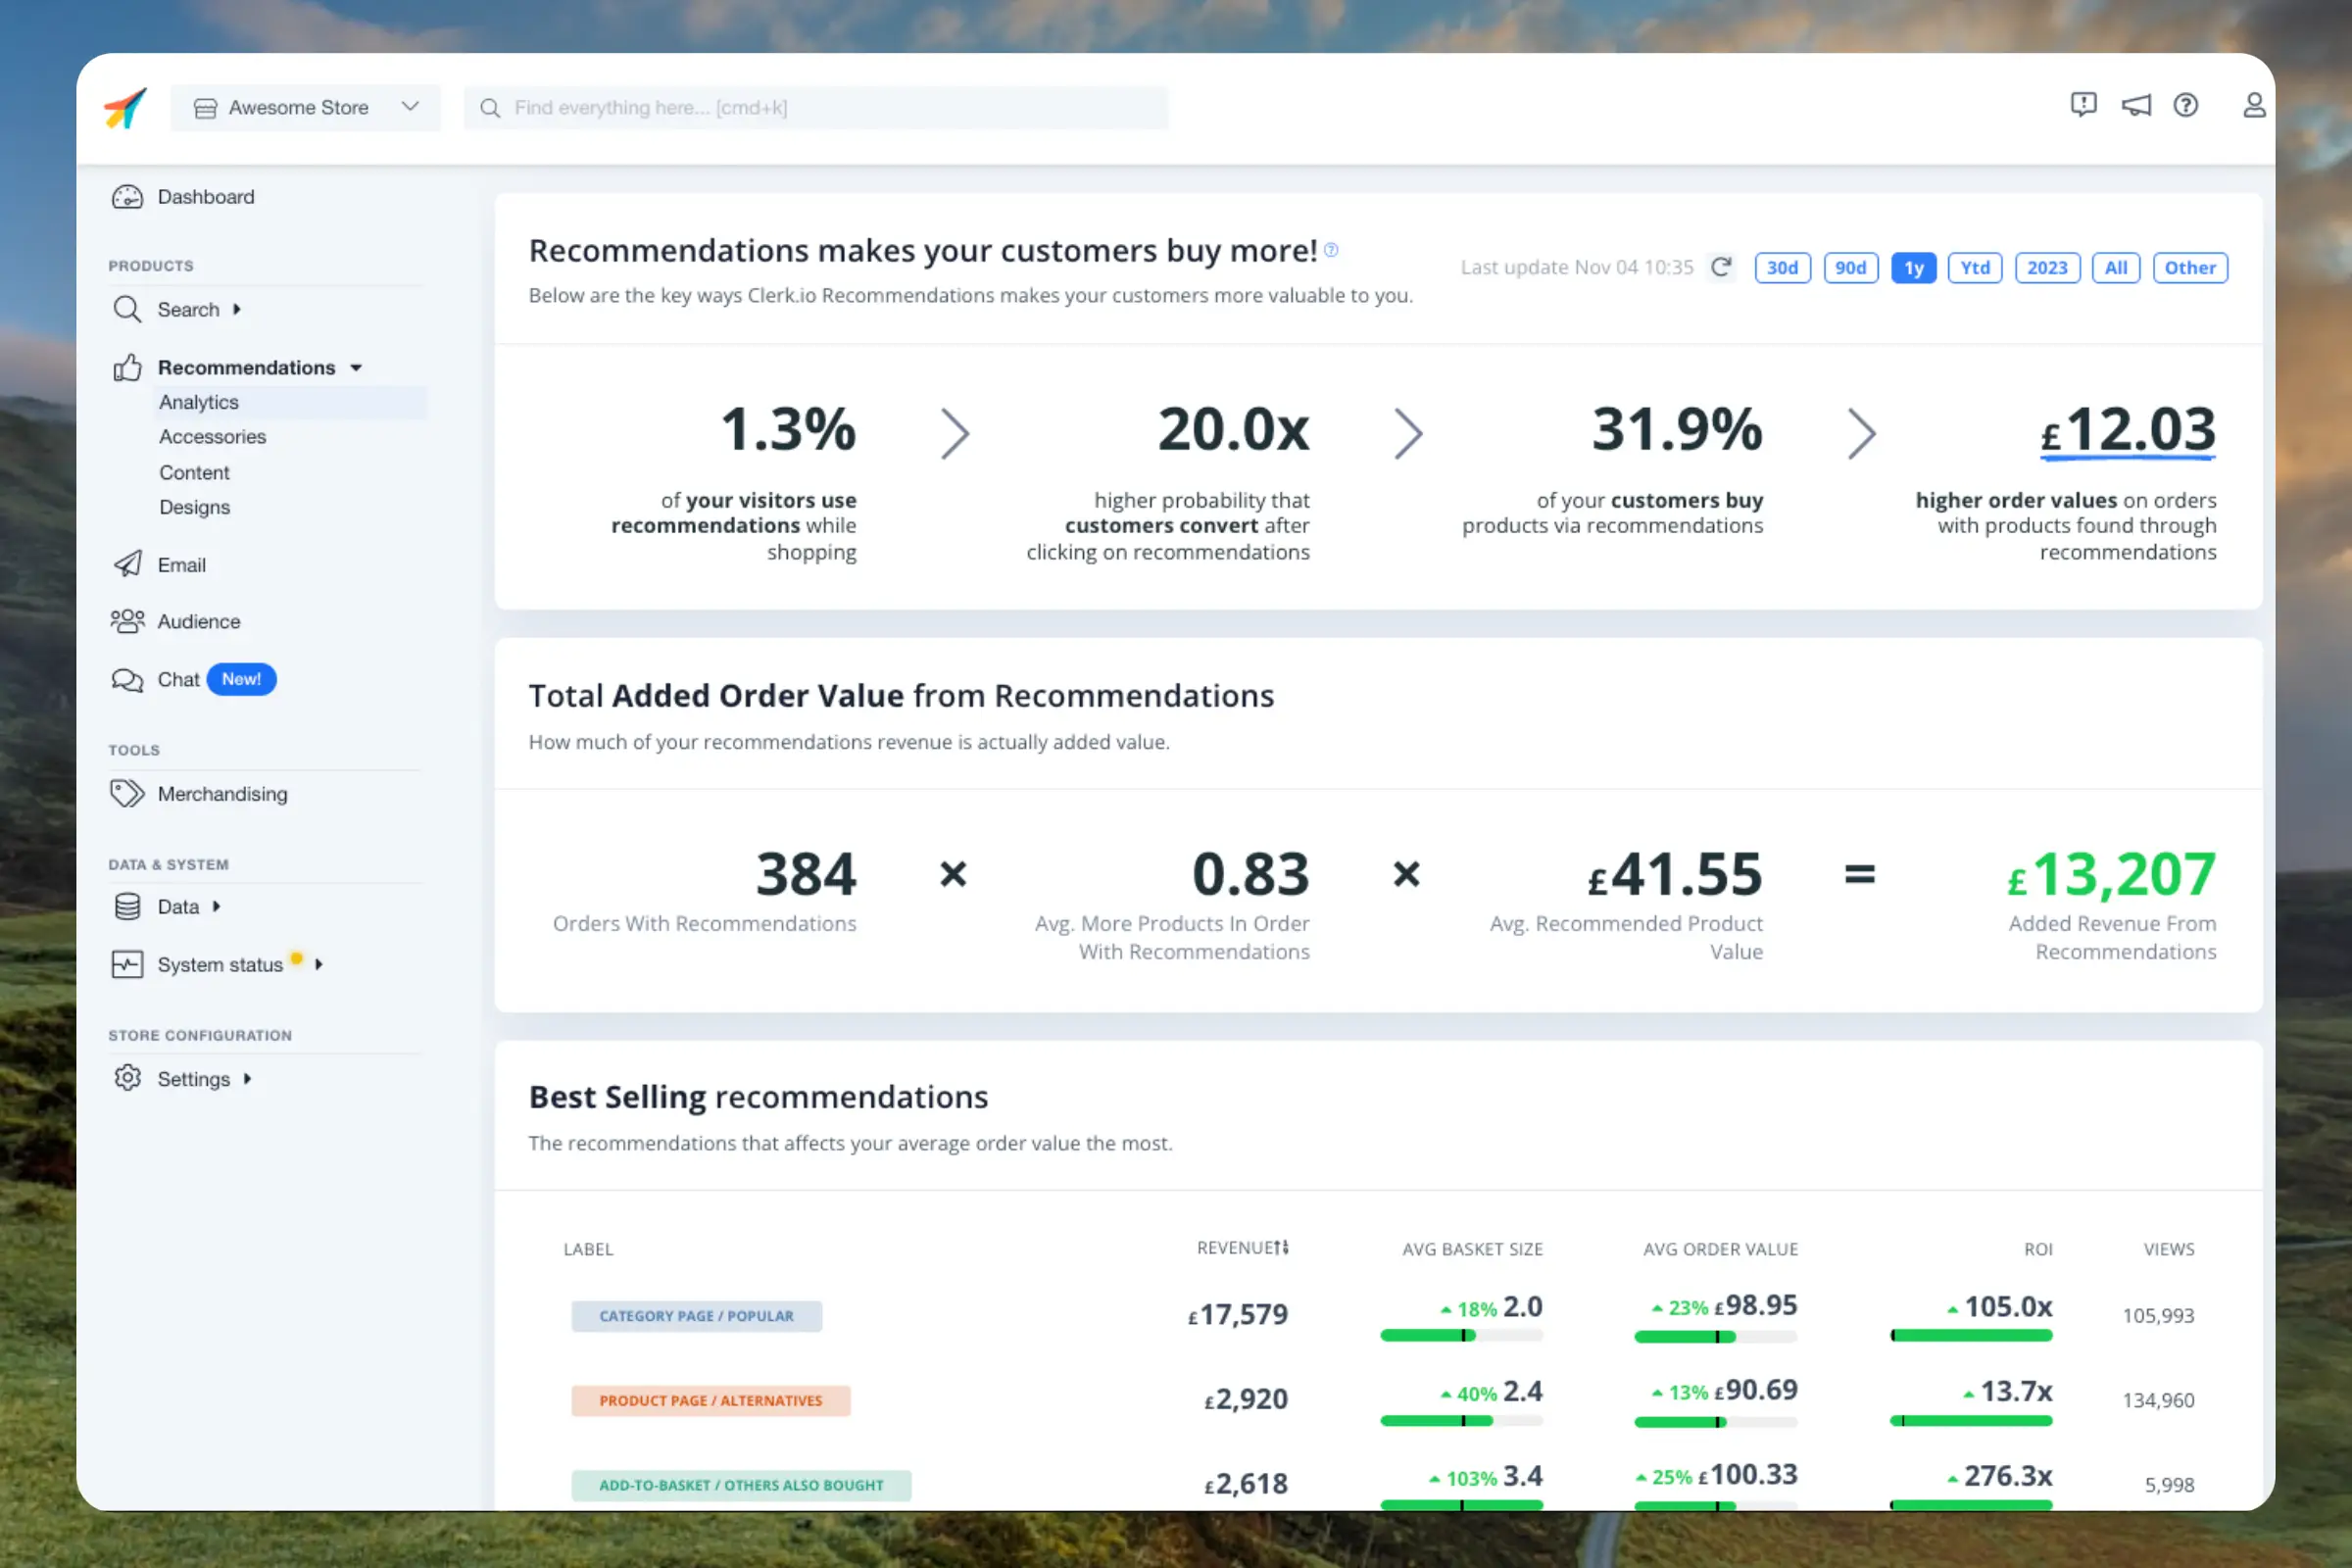
Timeframe #
Use the date-range selector to review 30 days, 90 days, one year, year to date, all data, or a custom period.
Revenue overview #
The overview cards show the selected period’s revenue through Recommendations, visitor usage, and orders impacted.
- Revenue through Recommendations: Revenue from products people found with Recommendations. This is the same Recommendations number as on Home.
- Visitor usage: The share of visitors who use Recommendations while shopping.
- Orders impacted: Orders containing at least one product bought through Recommendations.
Revenue is money. Visitor usage and orders impacted are shares, not money, so do not add these figures together.
Store comparison #
Recommendations Analytics compares conversion rate, average order value, and average basket size for orders that used Recommendations with your store average. This is a comparison, not a controlled A/B test.
Revenue over time #
The chart shows revenue through Recommendations for each day in the selected period.
Element performance #
The How each element is doing table compares revenue, average order value, average basket size, ROI, and impressions for each Recommendations Element.
Labels #
Labels identify each Recommendations Element. You can define them in Sliders or in API calls.
Ideally, each label should contain the placement of the banner and the logic it uses, e.g. Product Page / Alternatives.
When following our setup guides, we automatically add descriptive labels to the Recommendations elements.
When you create a Sliders element, its label matches the name you choose. You can change the label afterwards.
Label stats #
Click any label in the dashboard to open its details.
The label details page shows an overview of the performance for that specific placement, including:
- Timeframe: Use the date range selector to change the reporting period.
- Key metrics: Average order value, average basket size, average product value, and total orders.
- Top products: A table of the best selling products associated with the label, with an option to export as CSV.
- Latest orders: A table of the most recent orders impacted by the label, including the estimated impact, with an option to export as CSV.
- Related products: A tab showing which products are most often connected to the label.
Use the Recommendations setup guidance to decide what to change after reviewing these results.