How to Read the Audience Insights Dashboard
Audience Overview
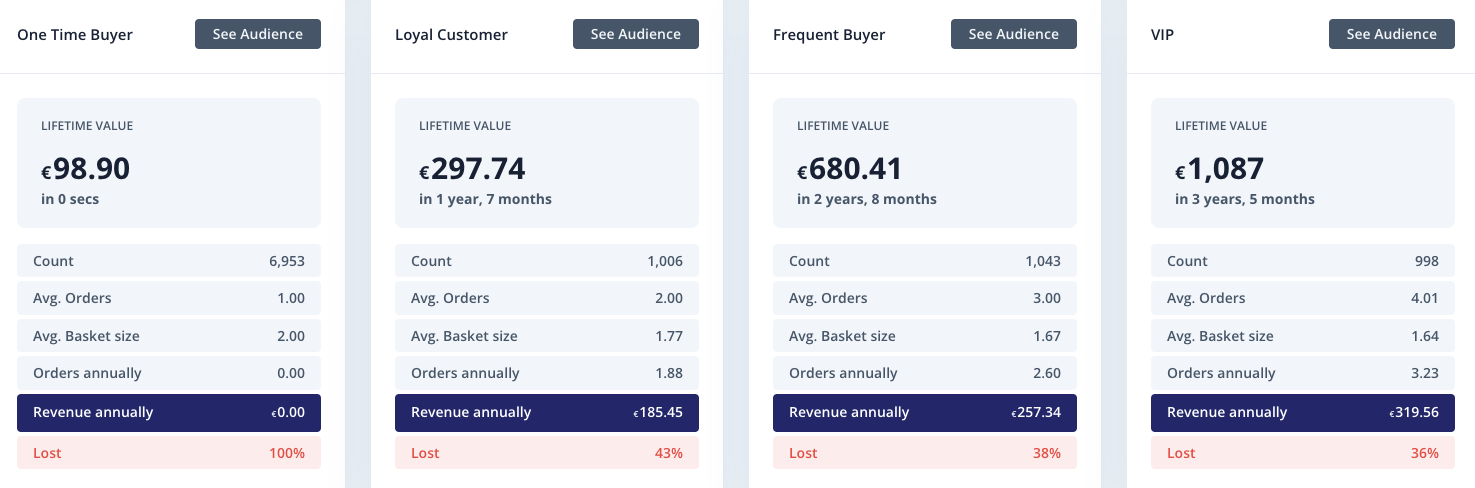
At the top of the Audiences dashboard, you’ll find your Audience groups broken out by name.
At a glance, you’ll find:
Lifetime Value of each customer within the Audience
Count: Number of customers within the Audience
Average Orders and Average Basket Size made by each customer in the Audience
Annual Orders made and Annual Revenue generated by each customer in the Audience
Lost: Percentage of Audience members who have been lost from the webshop
Active Customers
Click “See Audience” to get more details around each group and set filters around their product interests and purchases. You’re also able to filter by the Audience’s email subscription status, purchase behavior, and order stats.
The Active Customers breakdown is a high-level overview of your total customer count now vs. what that count was 1, 3, 6, and 12 months ago. Use this to track overall growth in your customer base over time.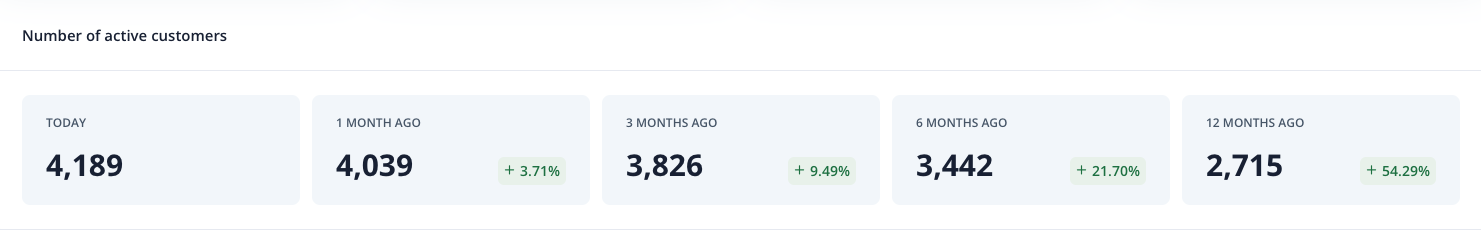
Customer Base Growth
In addition to showing the volume of customers in your store over time, the Customer Base Growth chart breaks down these customers further into New, Active, Slipping Away and Lost groups. You can filter to a specific timeframe or specific Audience to dig deeper here.
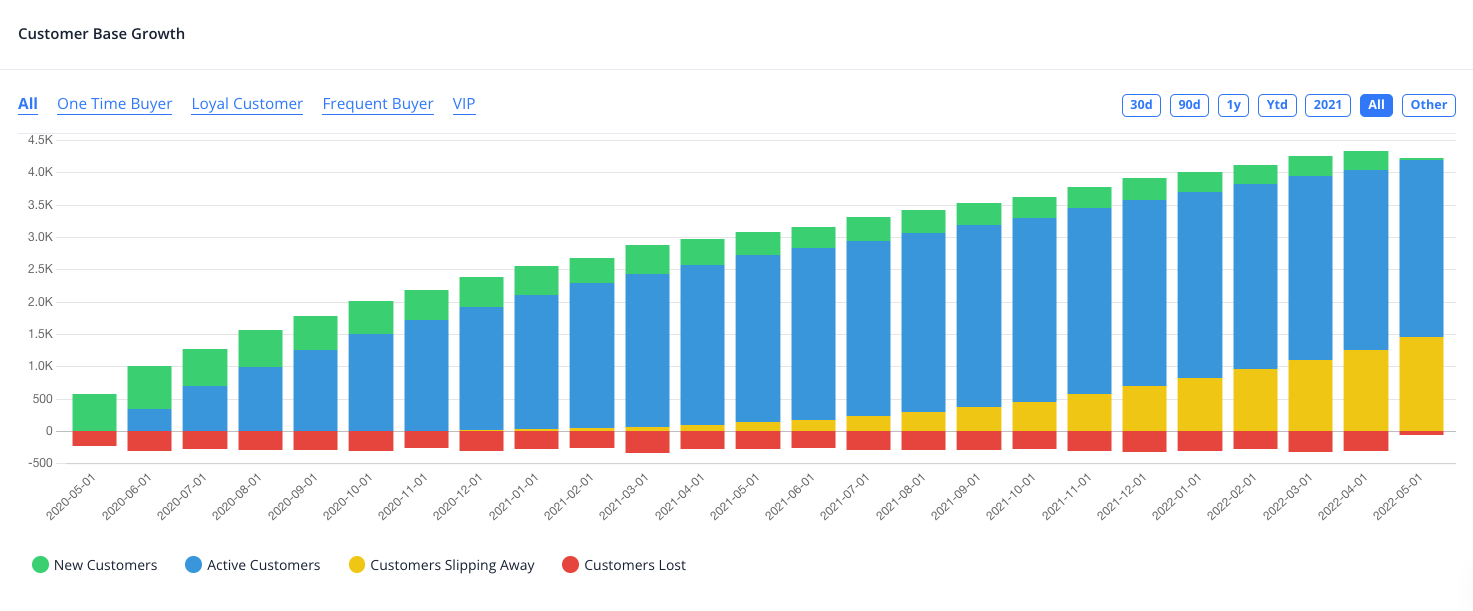
Here you’ll find the potential lifetime value of each Audience, broken down by their Active status. The blue bar visualises the proportion of revenue generated vs. other Audiences if your store tapped into the full potential value that Audience.
For more insight into the Audience Customer Analytics Dashboard click here.