How to Read the Email Insights Dashboard
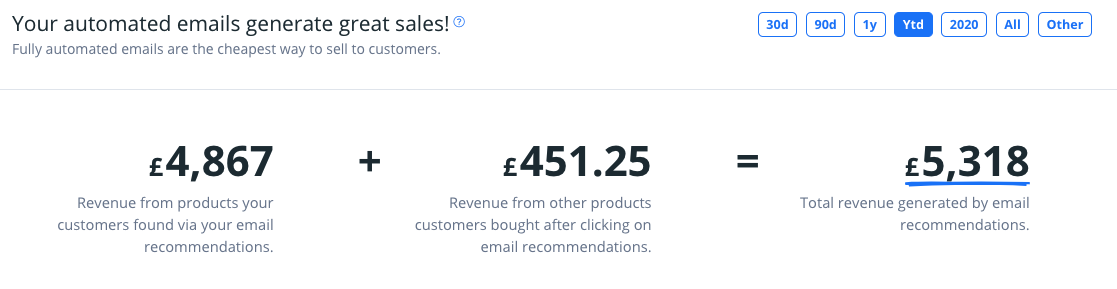
At the top of the Email Insights Dashboard, you’ll find:
Revenue generated through products directly found through Recommendations show through Email
Revenue from other products bought in your webshop after clicking through Email Recommendations
The combined total revenue of products found directly through Email Recommendations and those found on your webshop after clicking through Email Recommendations
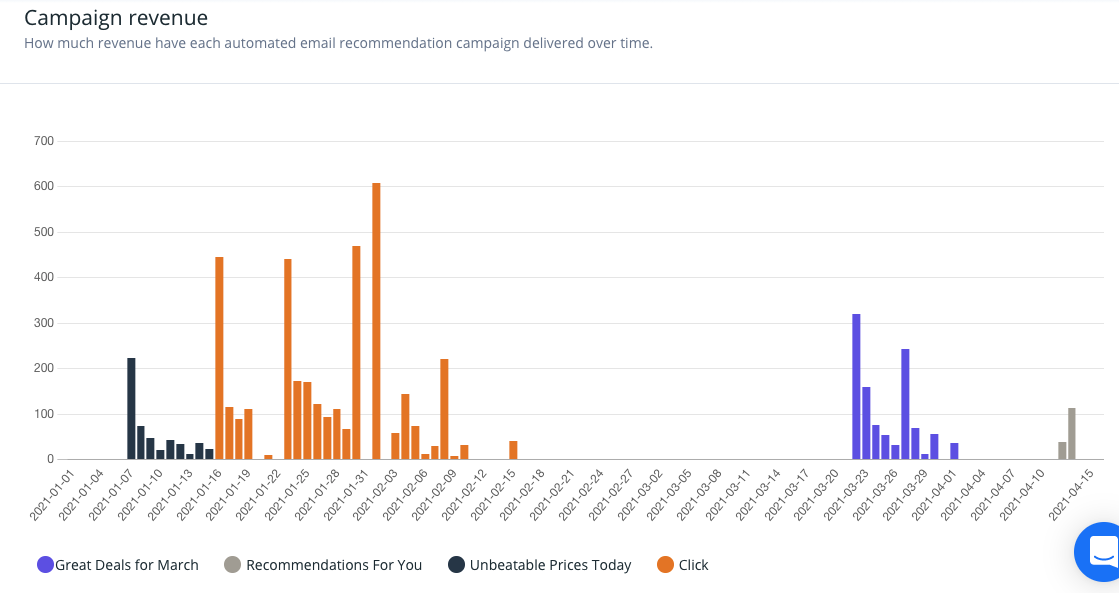
Campaign Revenue
Campaign Revenue breaks down the revenue generated by day Email recommendations. The Campaign Revenue chart is color-coded to specify each individual Email Campaign, making it easy to compare performance across strategies.
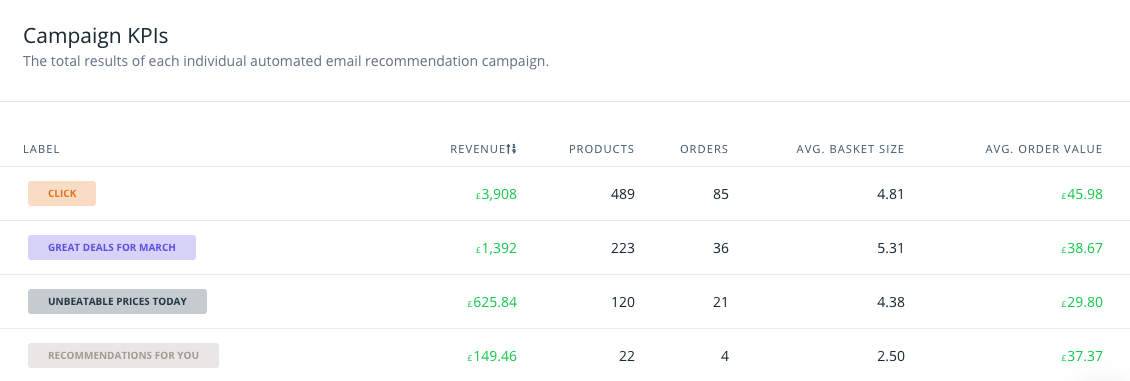
Campaign KPIs
Campaign KPIs are broken out by each labeled campaign, and include:
Revenue generated through the Recommendations included in the campaign
Number of Products and Orders made through the campaign, and
Average basket size and value of Orders made with the campaign
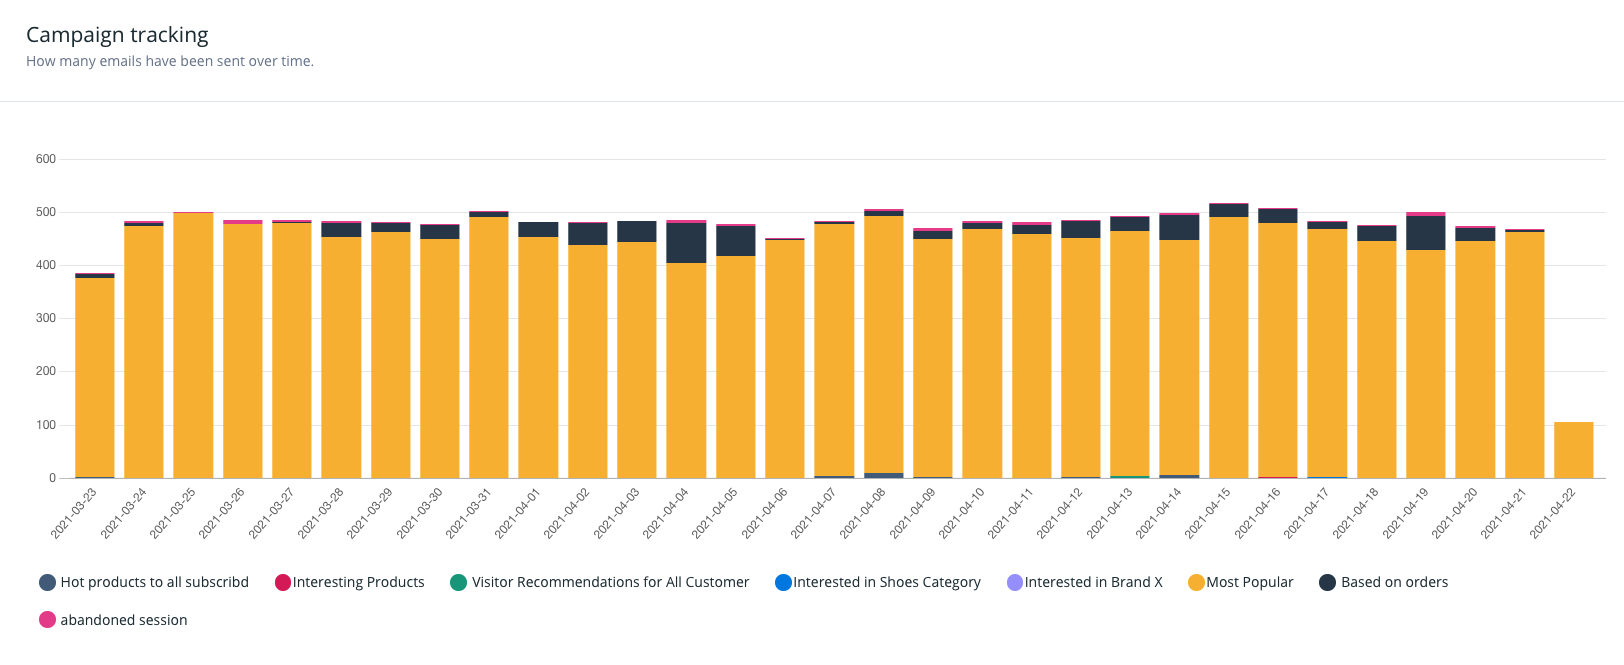
Campaign Tracking
Use Campaign Tracking to better understand the number of emails from each specific campaign that have been sent over time. Each campaign is broken out by color to easily compare the ratio of your campaigns being sent by date.
Label Tracking
With Label Tracking, you can track the number of emails clicked, opened, converted and sent over time.
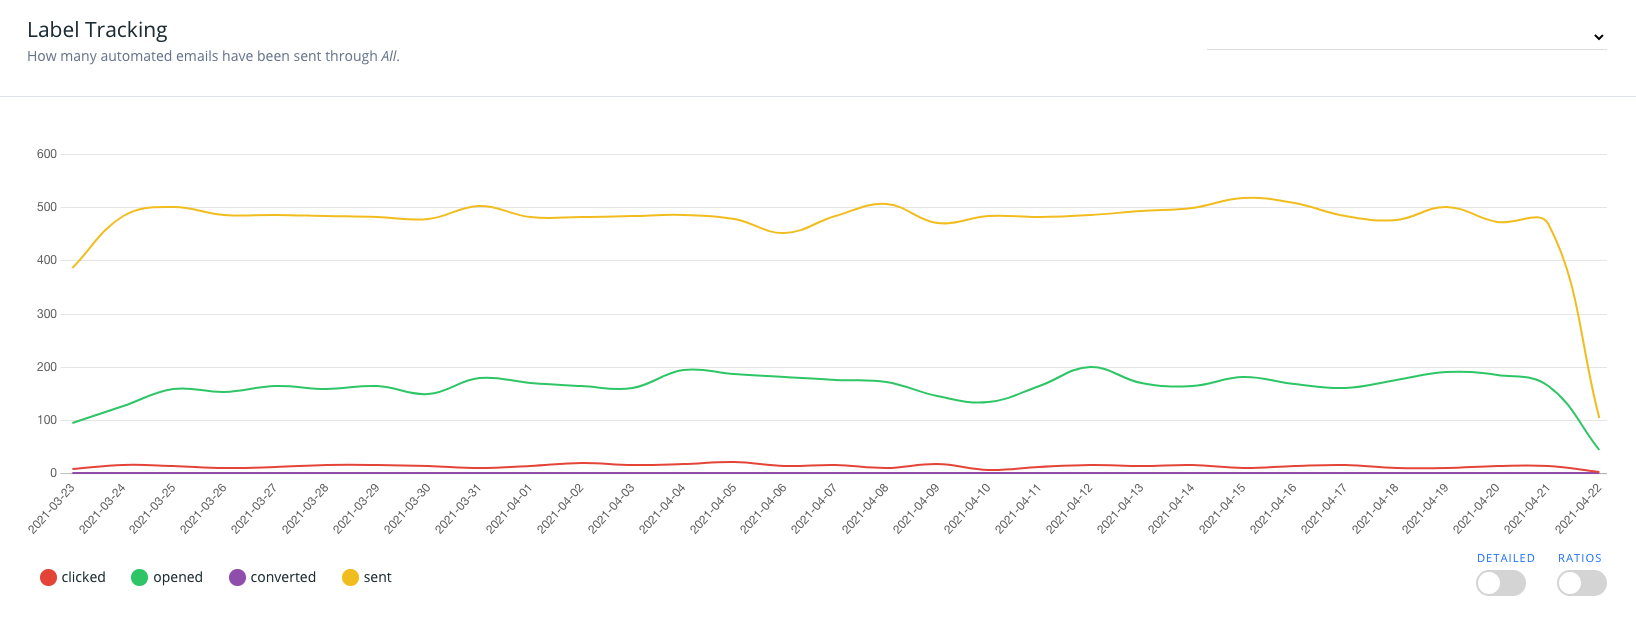
Label Tracking defaults to showing metrics for all campaigns. There is a dropdown option in the top-right corner to select specific campaigns to evaluate performance over time.
In the bottom-right corner, you can toggle on “Detailed” to see even more email performance metrics.
- Toggling “Ratios” will update the Y-axis to show email performance data by proportion rather than the default count of emails.
Campaign Stats
Campaign Stats details the performance of your email campaigns, broken down by each labeled campaign.
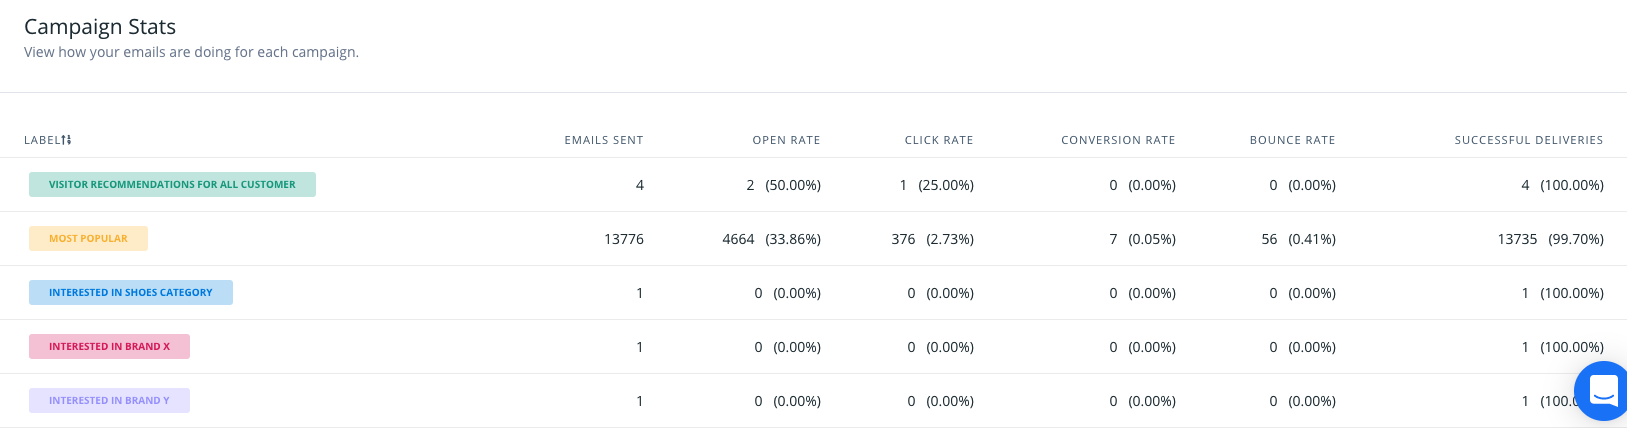
For each campaign, you can evaluate:
Emails Sent: Total numbers of emails sent within the campaign
Open Rate: Number of emails within the campaign opened
Click Rate: Number of emails clicked through after opening
Conversion Rate: Number of product sale conversions attributed to the email campaign
Bounce Rate: Number of emails sent within the campaign that didn’t reach the intended recipient
Successful Deliveries: Total number of emails within the campaign successfully delivered to recipients
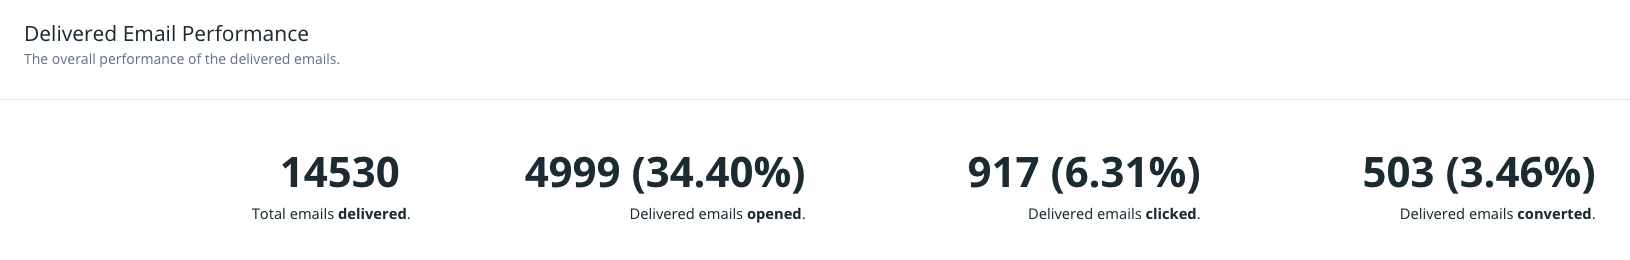
Delivered Email Performance
Use Delivered Email Performance to learn more about the total number of emails delivered, as well as the proportion of those emails that were opened , clicked through, and converted to product sales.