Measuring Impact
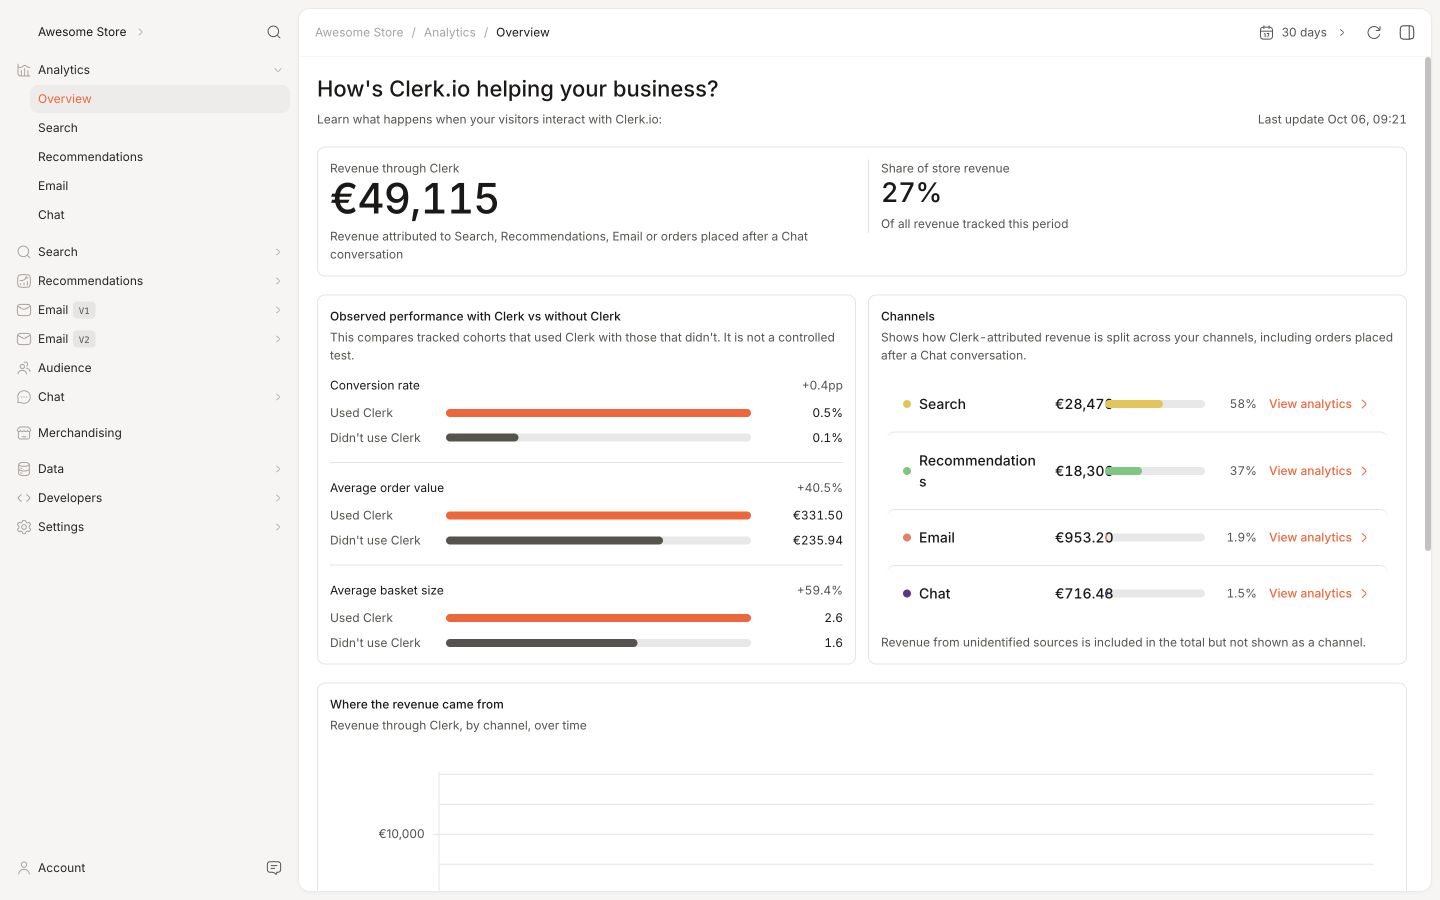
Using Clerk should technically be free - you should always earn substantially more than you pay for it. That’s why we’ve built a detailed Dashboard and Analytics for all products, to show how it helps your business.
Precise Tracking #
One of the great things about our Dashboards is that you can see exactly which orders were impacted by Clerk and how much more valuable they are.
An order is considered impacted by Clerk when a customer has bought at least 1 product from a Clerk element.
Clerk attributes a product as sold through Clerk when a visitor goes through these exact steps in the same session:
Click a product through a Clerk.io recommendation, chat or search result.
Proceed to put the product in their basket.
Place the order with the product in their basket.
Any other products in the order that were found elsewhere are considered organic.
Dashboard #
The Dashboard is the main performance overview for Clerk.io. Open it to see how Search, Recommendations, Email, and Chat contribute to your store’s tracked revenue.
Timeframe #
Use the date-range selector to switch between 30 days, 90 days, one year, year to date, all data, or a custom period.
Revenue overview #
The top cards show three high-level metrics for the selected period:
- Revenue through Clerk: Revenue from orders that used Search, Recommendations, Email, or Chat.
- Revenue gap vs visitors who didn’t use Clerk: The revenue gap between visitors who used Clerk.io and those who did not.
- Share of store revenue: The share of all tracked revenue that came through Clerk.io.
- Channels: Search, Email, Recommendations, and Chat. Open any channel’s own analytics to inspect it in more detail.
Revenue from unidentified sources is included in the total, but is not shown as a separate channel.
Visitor comparison #
The Visitors who used Clerk vs visitors who didn’t section compares conversion rate, average order value, and average basket size for the two visitor groups.
Important: This is a comparison, not a controlled A/B test. Use it to understand the difference between the two visitor groups, not to claim that Clerk.io caused the difference.
Revenue over time #
The Where the revenue came from chart shows where tracked revenue came from on each day in the selected period. It separates Search, Recommendations, Email, Chat, unidentified Clerk.io sources, and revenue not attributed to Clerk.io.
Similar stores #
The How your store compares with similar stores section gives you a rough indication of where your store sits for conversion rate, average order value, and average basket size. It is not an exact rank.
Action queue #
When the Dashboard identifies an opportunity to improve conversion, average order value, or basket size, the Action queue can show a Talk to an Expert action. Use it to ask a Growth Advisor to review your setup.
Orders #
Clerk tracks all orders from your webshop and gives you a single Orders overview for referencing how we get to the numbers in the Dashboard. This page merges the previous Tracked Orders and Order Details sections.
Orders overview #
Shows all orders Clerk receives—both orders tracked from the frontend and those imported via Data Sync. For orders tracked from the frontend, you’ll see the estimated value added by Clerk.
Orders are listed by their ID, and the time they were placed, so they reflect the listings from your webshop platform.
The overview gives you a quick insight into the impact from Clerk on recent orders, including an estimate of the value added.
When viewing orders in Clerk.io, you will see them marked with different sources:
- Tracked: Orders received via the sales tracking script in the frontend
- Synced: Orders received from the data sync with your platform
Order Details #
This lists all the orders that Clerk has received, whether through frontend tracking or by import. It’s used mainly to let you browse and reference any order that Clerk has access to.
Product analytics #
Each channel has a dedicated Analytics page with more detail:
- Search: Find the searches that generate revenue, expose demand, or return no results.
- Recommendations: Compare the performance of each Recommendations Element.
- Email: Review revenue from clicked products, full orders, embeds, and campaigns.
- Chat: Connect conversations with revenue, estimated time saved, topics, and unsolved chats.
Number Significance #
We often get the question of whether the Clerk impacted orders, would not have contained the same products even if Clerk was not used on the website.
It’s true that it’s impossible to know whether a customer would or would not have bought the same products by looking at any 1 order.
That’s why we at Clerk believe in transparent, statistical significance, which can always be seen through the Dashboard.
After all, if more than 100 orders have been impacted by Clerk.io, and these orders have an average of 10% increase in basket size and order value, it can no longer be by chance that Clerk makes customers buy more.
Clerk vs. GA #
Google Analytics (GA) is one of the most used analytics tools for eCommerce.
Many eCommerce owners use this tool to track important metrics, such as pageviews, searches, conversion rates, ROI of paid advertising and so on.
It is then natural to try comparing the data provided by GA with the data calculated by Clerk.io, especially regarding Clerk.io’s product usage
However, the two tools are meant to measure different metrics with different calculation logics. Here are the main differences:
Search #
- By default, GA only measures searches from the actual search page, as it’s based on pageviews.
- Clerk measures searches for both the Search Page and dynamic results shown by Instant Search or Omnisearch while the visitor is typing. This means that Clerk will show a higher number of searches and more realistic insights.
Recommendations #
- GA only registers individual pageviews and does not consider the number of recommendation banners installed. Further, the number of pageviews can differ from Clerk since GA’s tracking script is often blocked by Ad Blockers.
- Clerk shows the total number of recommendation banners viewed across pages. If your product page has 2 banners and 1.000 views pr. month, your monthly usage for this page is 1.000 x 2 = 2.000.