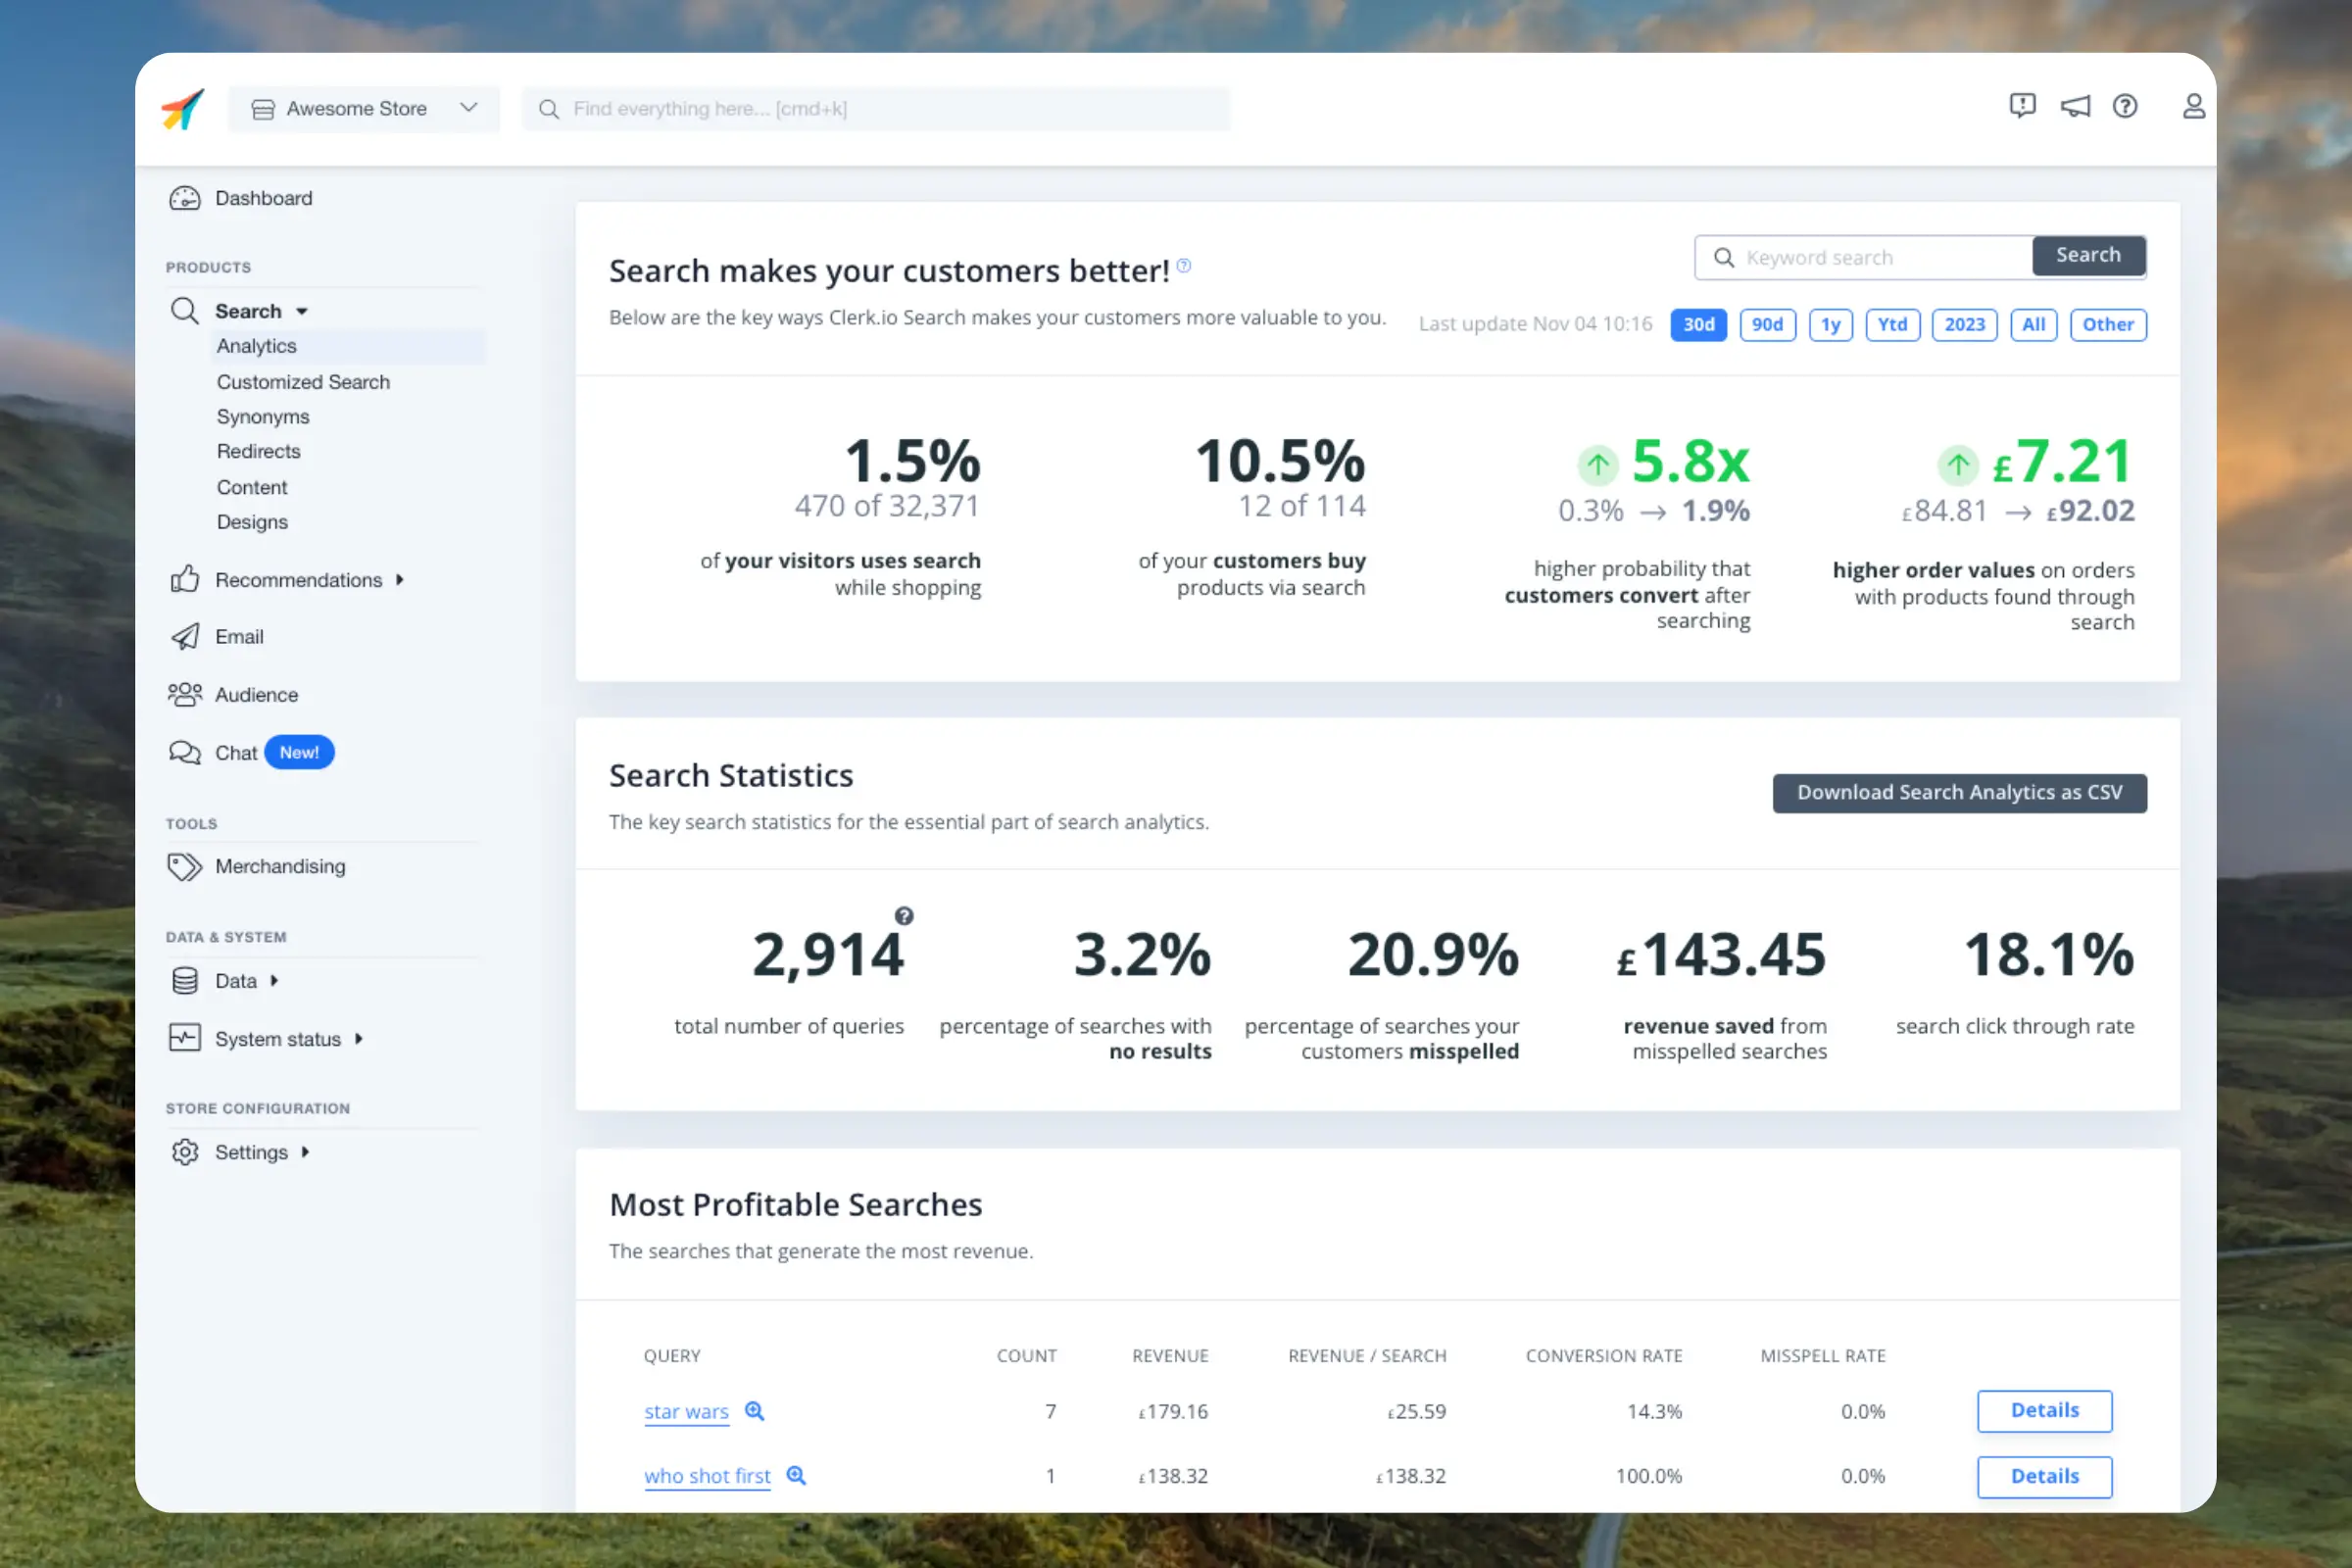
Analytics

Timeframe #
By default, the dashboard shows the performance over the last 30 days, but this can be customised with the date-range selector in the top right corner.
Overview #
Shows the main performance indicators for the given timeframe.
- The percentage of all visitors that has at least 1 search in their session.
- The percentage of customers that bought at least 1 product through Search.
- The probabilty of a purchase happening when customers interact with Search.
- The increase in avg. order value for orders with at least 1 product found through Search.
Statistics #
The underyling numbers related to how much Search is used in various aspects.
- Total number of queries: Searches made across all visitors, regardless of whether any matches are found. This will be higher than Usage which counts API calls that successfully returned results.
- Percentage of searches with no results: Specifies the proportion of searches that has no matches.
- Percentage of searches misspelled: Percentage of queries where Clerk corrected a spelling mistake and still showed results.
- Search click through rate : Percentage of searches that caused visitors to click on a product.
Top Searches #
These tables shows the most profitable, popular and misspelled queries respectively. Each table has the following metrics for each query:
- Count: Number of searches made.
- Revenue: Earnings from products sold.
- Revenue / Search: The avg. revenue made each time someone searches for the query.
- Conversion Rate: How often this query leads to a sale, measured as a percentage of searches divided by conversions.
- Misspell Rate: How often this query is misspelled and fixed by Clerk, measured as a percentage of mispellings made divided by searches for this query.
- Details: Narrows down the entire Analytics to queries containing this word or phrase
Most Profitable #
Queries that are generating the most revenue. Sorted by highest revenue first.
Most Popular #
Queries that are searched for the most, regardless of conversions. Sorted by highest amount of searches first.
Most Misspelled #
Queries that Clerk most often have to correct when showing results. Sorted by highest amount of searches first.
We define a misspell as a search that contains variations of words found in the texts we have imported for products, categories and pages. These can be missing characters, too many characters, spaces added to compound words and more.
Actionable Searches #
These tables show the queries that should be taken action upon, and Search Analytics allows you fix many of them directly in the dashboard.
It’s common to find queries where visitors use words you do not have in your texts yet, which can be solved with synonyms, or to discover that visitors are looking for products you don’t have in stock yet.
This makes it easy for you to focus on the queries you should improve first.
Each query gives you access to:
- Count: The number of times the query was made.
- Add Products: Sends you to the Rules section letting you manually associate products to the query.
- Add Synonym: Sends you to the Synonyms section for connecting similar words to the query for showing better results.
- Details: Narrows down the entire Analytics to queries containing this word or phrase.
Non-Converting #
Queries that did not lead to a conversion. This can be due to a number of reasons, like:
- Visitors looking for a color or size variations you don’t have in stock
- A design that lacks necessary info, like pricing, discounts or images
- Visitors using more specific queries to find products. Click “Details” for a query to check how visitors include it when searching.
No Results #
Queries that did not have any matches. This can be due to a number of reasons, like visitors looking for:
- Product selections you don’t yet have.
- Brands that are not in your catalogue yet.
- Words that are not yet part of your product texts.